Neurosciences
NeuroZoom
Clients - The Scripps Research Institute and Mount Sinai School of Medicine, National Institutes of Mental Health, Human Brain Project
![]()
(Circa 1997) NeuroZoom is a mapping program that works with light and laser microscopes, computerized stages, video and electronic cameras, camera lucidas, and file-based images. Specialized modules in NeuroZoom support stereologic mapping, which is unique because not only is stereology supported for unbiased counting and estimate of profile numbers, but because it is combined with mapping such that whole tissue sections, as well as serial tissue sections, can be mapped out within one context, and analyzed with traditional morphometric tools, or applied against stereology methods.
Many different devices are supported within NeuroZoom. NeuroZoom can adapt to the equipment available in different laboratories. For example, if the Macintosh computer supports QuickTime and an electronic camera is attached, live video can be displayed in the window while mapping structural data. As the field is mapped, a motorized stage on the microscope is automatically moved to adjacent fields. This ensures that collected data are always aligned to the image coming from the microscope.
While the most basic function of NeuroZoom is to facilitate the mapping of neuroanatomic structures imaged by light microscopy, file-containing images can also be opened and mapped with NeuroZoom. A three dimensional module allows for real-time 3D visualization of the collected data. Finally, a database module allows for comparison of the data with other libraries of shared information.

A microtome used to slice brain tissue with a camera focused on the block face to capture images as they sliced.

A closer view of the sliding microtome surface.

A computerized microscope controlled with NeuroZoom.

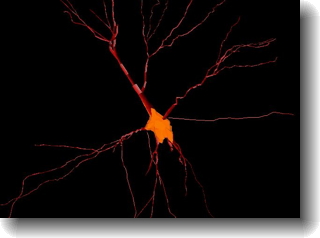
(1:48, 3.5 MB MPEG4) Movie of a reconstructed rat brain cell (soma and dendrite).
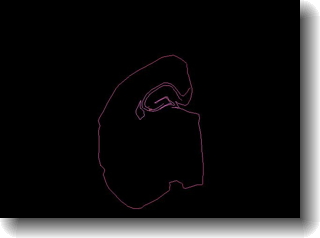
(2:24, 4.4 MB MPEG4) Movie of a rat brain section outline with a single cell and other landmarks mappted in 3D.
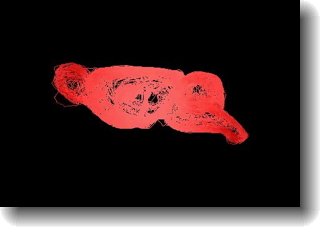
(0:12, 0.7 MB MPEG4) Movie of a reconstructed serial section outlines, aligned into the external wireframe model of the rat brain.
Documentation
These are the final versions of the documents - User Guide and Reference - that accompanied the software system in a resolution suitable for viewing. A higher resolution set was also available for printing. In 1997, a brochure was also created to accompany distribution at the Society of Neurosciences meetings.
Testimonials
Here is a testimonial from QKS, the company that produced the Smalltalk based software development system on which NeuroZoom was written.
Stereology
NeuroZoom's stereology package is a collection of tools designed to make unbiased counting and measurement of biological materials accessible and simple. The user decides what type of
analysis to do and follows accepted guidelines of sampling and tissue handling. The appropriate analysis is chosen, and NeuroZoom takes the user through a series of simple steps that
culminate in an unbiased estimate of the value in question. Since NeuroZoom controls the microscope, there is no need to take large numbers of photographs or capture hundreds of images.
Data acquisition and analysis are accomplished at one sitting, and images can even be captured during the process for record-keeping purposes without interfering with quantification.
Three-dimensional counting
For optical disector and fractionator analyses, the disector principle has been adapted in NeuroZoom to maximize efficiency. Thus, rather than take a single disector pair of images, NeuroZoom sequentially presents a stack of disector pairs, such that the counting frame of one pair becomes the lookup frame of the next. These stacks of disectors are called "multisectors." Note that this is not the same as a cube of tissue in which one scans continuously up and down. With NeuroZoom the user steps through the cube in z-steps of his or her choosing, and analyzes each counting frame independently. Of course the user can easily return to any z level to check on a structure.
Systematic random sampling
For fractionator and optical disector analyses of particle number, the placement of multisectors is determined by several steps. The user outlines the region of interest at low magnification and specifies the dimensions of the counting frame. For the fractionator analysis, the user enters the counting fraction, and NeuroZoom places the multisectors within the region of interest such that the desired percentage of cross-sectional area is sampled. Sampling is performed in a systematic random fashion, that is, NeuroZoom chooses a random set of x,y coordinates, and uses that point as the origin of a grid with a repeating pattern of counting frames. Thus the placement of the grid is truly random, and the positions of the multisectors is systematic random. This is a more efficient way of sampling than truly random sampling.

Data analysis and databasing
As mentioned above, NeuroZoom performs all calculations, using standard stereologic formulas. Calculations of variance and coefficient of error (CE) are part of every report, and are useful for optimizing studies. Each data report includes information regarding the configuration of the microscope, objectives, stage, counting frame if relevant, and other variables in use during data acquisition, so that the quantitative data obtained can be interpreted in context long after the session is over. In addition, data acquired using NeuroZoom can easily be included as part of a larger database for analyses at multiple levels.

Immunocytochemistry
Unlike dyes such as cresyl violet and hematoxylin and eosin, immunocytochemical staining techniques are dependent on the diffusion of very large molecules (some as large as 1000 kDa, such as an IgM molecule) through tissue. This can be assisted by tissue permeabilization using detergents, but these processes often severely compromise the staining desired. Therefore, staining is often performed on relatively thick sections without permeabilization. This preserves tissue integrity but may result in a significant layer of unstained tissue in the middle of the section, which varies widely in its depth throughout the sample. This layer can interfere with accurate cell counts or other measurements when using certain other stereologic approaches which involve making counts in a preset depth of tissue. NeuroZoom circumvents this problem by allowing the user to count at variable depths, depending on the staining penetration at any given location. This is accomplished while keeping track of the coordinates and the data entered, so calculations remain accurate.

Complex and layered objects
NeuroZoom was designed with an interest in obtaining quantitative data on numerous different types of biologic objects. This includes simple objects, such as cells or brain nuclei, but also includes geometrically more complex objects, such as convoluted and layered objects. In particular, structures such as neocortex can be especially challenging, since their layers have different functional significances, and one may want to be able to combine them in different combinations. For instance, one might want to know the number of neurons in layer II of primary somatosensory cortex, or in layer III, or in the combined layers II-III. Using NeuroZoom, by mapping only the borders between layers, one can generate any number of combinations to produce many regions of interest for analysis. This provides flexibility, and permits the user to obtain a great deal of data with a minimum of preparatory mapping.
